

A space stock dashboard is a live data terminal that tracks the prices, financials, and mission activity of publicly traded space and satellite companies in one place. For actual research work, skip generic stock screeners and use a sector-specific terminal built for this niche. Martian Alpha is a practical fit because it pairs real-time quotes with company profiles, a launch and catalyst calendar, and automated alerts.
TL;DR:
- A space stock dashboard must include live price data that clearly indicates session status, as stale or delayed quotes can lead to costly investment mistakes.
- Custom watchlists with alerts for price movements, news, and contract announcements are essential, as sector-specific events can trigger significant stock moves beyond typical thresholds.
- Company profiles should feature sector-relevant data like contract backlogs, launch manifests, and constellation sizes, not just standard financials, to accurately assess space companies.
- Sector-specific screens and filters are necessary for accurate segmentation, such as distinguishing pure satellite operators from diversified defense primes, avoiding sector performance misinterpretation.
- Verifying data freshness involves checking disclosed data sources, cross-referencing trades with exchange timestamps, and ensuring session badges reflect market open and close states.
Table of Contents
- What Should a Space Stock Dashboard Actually Include?
- How Real-Time Is "Real-Time," and How Do You Verify It?
- How Do You Turn Dashboard Data Into a Repeatable Workflow?
- How Does a Terminal Like Martian Alpha Cover These Needs?
- Why Price Alone Misses Half the Space Investing Picture
- Get Your Own Space Stock Dashboard Running Today
- Where to Verify Space Sector Data Yourself
- Sources
- FAQ
What Should a Space Stock Dashboard Actually Include?
Most stock screeners treat aerospace like any other sector. That is the wrong approach. Launch cadence, contract wins, and orbital slot allocation move these stocks in ways a generic P/E screen will never catch. A dashboard built for this sector needs a specific set of components, not a repurposed general-market template.
Live price data with session context. A ticker that just shows a number is close to useless. You need to know whether that price reflects an active trade during regular hours, an after-hours move on thin volume, or a pre-market gap on rumor. A well-designed dashboard organizes macro-leading data first, like futures and indices, before drilling into individual names, and flags the market session clearly so you are not mistaking a frozen quote for a live one.
Watchlists and multi-trigger alerts. Price alerts alone miss half the story in this sector. A contract award, a launch delay, or a regulatory filing can move a stock more than a two percent intraday swing. The dashboards worth using let you set alerts on news events and award announcements, not just price thresholds.
Company profiles with sector-specific data. A profile page needs market cap, revenue, and P/E where applicable, the same way any exchange quote page presents it. But it also needs contract backlog, launch manifest position, and constellation size for satellite operators. That is the layer generic finance apps never build because it only matters to a few hundred stocks worldwide.
Screener filters built for the industry. "Pure-play satellite operator" and "defense prime with a small space division" are two entirely different investment theses, and a generic screener cannot tell them apart. Filters for launch provider versus satellite operator versus orbital services materially shorten research time for anyone tracking this space full time.
Heatmaps, sparklines, and embeds. A sector heatmap shows you which sub-segment is moving before you dig into individual tickers. Export or embed options for a ticker tape or heatmap widget matter if you want that data visible on a personal research board instead of buried in a browser tab.
Here is the short version of what to check before you commit to any platform:
- Real-time price feed with a visible session state indicator
- Custom watchlists with price, news, and contract-award alerts
- Company profiles including financials, launch manifest, and constellation data
- Sector-specific screener filters (launch provider, satellite operator, defense prime)
- Heatmap and ticker-tape embeds for external use
Pro Tip: Before trusting any screener filter labeled "space stocks," check whether it separates pure-play satellite and launch companies from diversified defense primes. Lumping them together skews sector performance numbers and hides which sub-segment is actually driving the move.
How Real-Time Is "Real-Time," and How Do You Verify It?
"Real-time" gets used loosely, and the gap between tick-by-tick data and a 15-minute delayed feed can cost you a meaningful entry or exit point. Knowing which one you are looking at matters more than most investors realize.
During US market hours, a genuinely live feed updates on every trade, matching the timestamps you would see on an exchange's own quote page. Outside those hours, equity prices freeze at the last close while futures and crypto continue streaming, which is exactly why session badges matter. A dashboard that does not clearly mark pre-market, regular, and after-hours states will make a stale Friday closing price look identical to Monday's live open.
The complication is that dashboards rarely run on a single feed. Many combine an exchange API for pricing with separate feeds for earnings, launch schedules, and contract announcements, and licensing terms often mean the free tier of a product gets a delayed feed while paid tiers get the live one.
A few checks before you trust a number on screen:
- Look for a disclosed data provider name, not a vague "real-time data" claim with no source.
- Watch how fast a quote updates against a known catalyst, like a scheduled earnings release.
- Cross-reference a printed trade time against the exchange's own timestamp for that same trade.
- Check whether the session badge changes correctly at market open and close.
Data providers routinely disclose a 15-minute delay on certain index and options data even when equity quotes are live. That gap is the single most common source of confusion investors report when a dashboard "shows the wrong price."
How Do You Turn Dashboard Data Into a Repeatable Workflow?
A dashboard is only as useful as the process built around it. Screening, catalyst tracking, and intraday monitoring should function as three separate, repeatable habits, not one big glance at a homepage.
-
Screen by category first, then by fundamentals. Start by separating pure-play satellite operators and launch providers from mixed defense primes with a small space division. Then layer in revenue growth, contract backlog, and cash runway. A satellite operator with eighteen months of runway and no signed contracts is a different risk profile than a prime with a diversified balance sheet.
-
Build a catalyst calendar around your watchlist. Launch dates, contract award announcements, and earnings calls each carry different risk profiles. A scrubbed launch can knock a small-cap operator down double digits in minutes. Feeding these dates into an alert system beats checking a calendar manually every morning.
-
Monitor top movers with correlation context. When a satellite stock jumps five percent intraday, check whether the broader sector moved with it or whether it is an isolated, news-driven spike. Cross-reference against futures and yields if the move looks macro-driven rather than company-specific.
-
Run a standing portfolio surveillance template. Set position-sizing reminders tied to volatility, and define in advance what event triggers a review, not just a price alert. A missed launch window or a delayed FCC filing deadline should trigger the same scrutiny as a ten percent price drop.
Pro Tip: Set your contract-award alerts to cover subcontractors too, not just the prime. A small satellite component supplier can move more on a NASA subcontract than the prime contractor does on the headline award.
How Does a Terminal Like Martian Alpha Cover These Needs?
Every workflow above maps to a specific feature set, and building that stack yourself across five different apps wastes time you could spend on research. A dedicated terminal exists precisely to close that gap.
Martian Alpha's CANSLIM screener, launch calendar, AI-powered company analyses, automated alerts, and community feed line up directly against the checklist from earlier sections. The screener handles the pure-play versus prime distinction. The launch calendar covers catalyst tracking without a manual spreadsheet. Alerts fire on price and news events together rather than forcing you to choose one.
Beyond the feature checklist, the platform layers in a macroeconomic briefing system to contextualize sector moves against broader market conditions, and gamified trading simulations for investors who want to test strategies before committing capital.
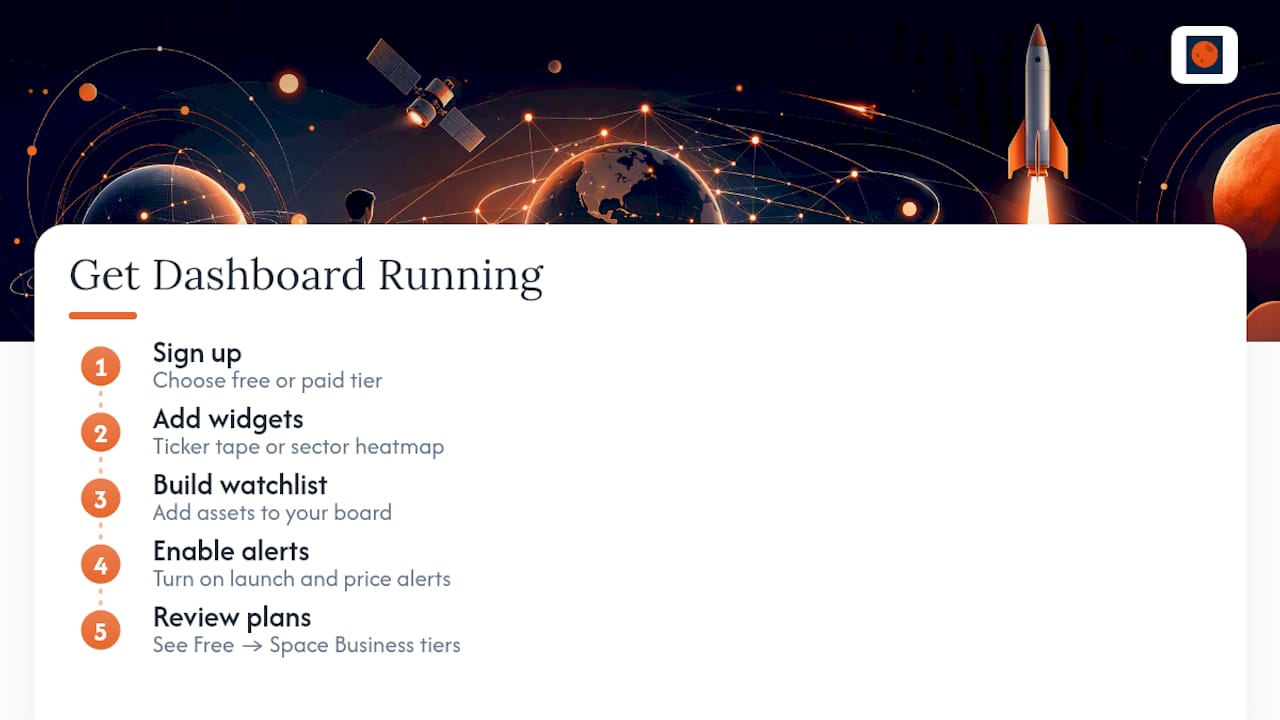
Getting started takes three steps: create an account, build a watchlist around the tickers you already follow, then enable the launch calendar and price alerts so catalysts surface automatically instead of requiring a daily manual check.
| Investor need | Martian Alpha feature |
|---|---|
| Separate pure-play from prime contractors | CANSLIM screener with sector filters |
| Track launches and contract catalysts | Launch calendar and contract award feed |
| Get notified without checking manually | Automated price and news alerts |
| Understand company fundamentals fast | AI-powered company analyses |
| Learn from other investors' reasoning | Community feed |
Why Price Alone Misses Half the Space Investing Picture
Watching price action without private market context is like reading the last chapter of a report. Seraphim's tracking of private deal flow and funding data matters because venture capital moves into satellite and launch companies well before those bets show up in public earnings. A funding drought in a sub-segment often precedes a public-market correction by months.
Operational metrics deserve more weight than they usually get, too. Launch cadence and reliability records tell you more about a launch provider's near-term revenue than a single day's stock chart. When a company's reliability metrics improve while its stock stays flat, that gap is often the setup, not the noise.
A simple weekly checklist cuts through most of the noise: review your watchlist's contract-award history, check upcoming launches against your positions, and scan for any private funding news in your sub-segment before Monday's open.
— DaDevMate
Get Your Own Space Stock Dashboard Running Today
Martian Alpha's advantage over building a research stack from five separate apps is simple: every space-sector-specific tool, screener, calendar, and alert system lives in one terminal instead of scattered across generic finance apps and manual spreadsheets. The core research tools stay free.
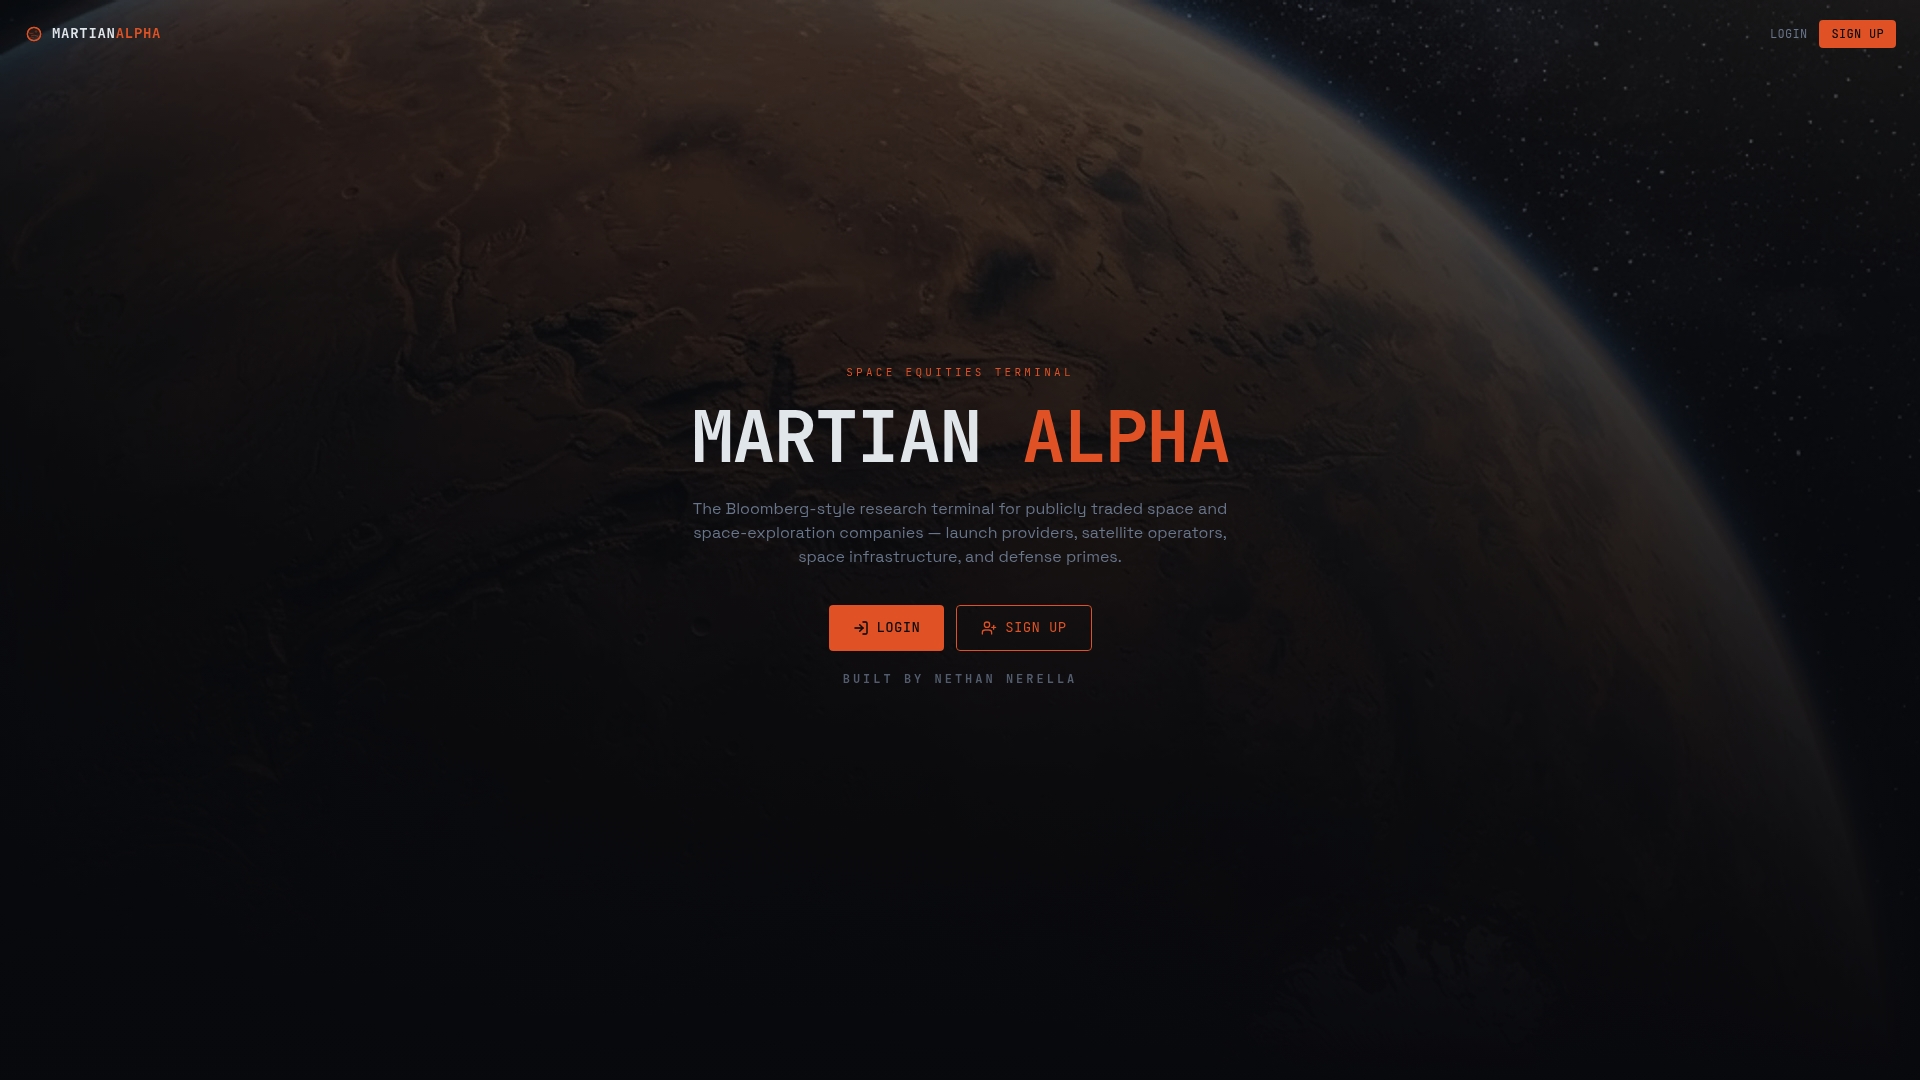
Getting started takes a few minutes. Sign up on the plans page to see what's included at each tier, from the free plan up through Space Professional and Space Business. Once you're in, add a ticker tape embed or a sector heatmap to your own research board, then build your first watchlist and turn on launch and price alerts.
Worth knowing upfront: deeper historical datasets and some power-user analytics tools sit behind the paid tiers, starting at a low monthly price for Space Enthusiast. The core screener, launch calendar, and alerts work on the free plan, which covers most of what a retail investor needs to start tracking the sector seriously. Check current plan details on the Martian Alpha site before upgrading.
Where to Verify Space Sector Data Yourself
A few sources are worth bookmarking alongside any dashboard you use:
- Nasdaq's company quote pages for exchange-verified price, volume, and 52-week range data
- Yahoo Finance's quote pages for analyst coverage and community sentiment on individual names
- Seraphim Space Index for private deal flow and funding context that public dashboards typically miss
- Stock Titan's space stocks hub for sector-wide company counts and aggregated performance figures
Cross-checking any single dashboard's numbers against an exchange's own quote page takes thirty seconds and catches most discrepancies before they cost you money.
Sources
- Seraphim Space Index | Global SpaceTech Investment Data
- Free Live Trading Dashboard — Real-Time Stocks, Futures, Crypto & Forex
- Space Exploration Technologies Corp. Class A Common Stock (SPCX) — Nasdaq
FAQ
What Is the Latest News on SpaceX Stock Today?
SpaceX remains privately held, so there is no publicly traded common stock ticker to track on a standard exchange dashboard. Investors interested in SpaceX exposure typically watch secondary-market share transactions or funding round valuations rather than a live public quote.
Who Is the Biggest Shareholder of SpaceX?
Elon Musk holds the largest stake in SpaceX as its founder and CEO, alongside institutional investors that have participated in its private funding rounds. Because the company is private, exact ownership percentages are not publicly disclosed the way they would be in SEC filings for a listed company.
What Are Some Promising Publicly Traded Space Stocks to Watch?
Rather than a fixed list, the smarter approach is screening by category, pure-play satellite operators, launch providers, and defense primes with space divisions, then filtering by contract backlog and launch cadence. A sector-specific screener built for this distinction surfaces candidates faster than a generic stock screener that treats aerospace as one undifferentiated group.
What Is the Current Price Target for SpaceX?
Because SpaceX is not publicly traded, there is no exchange-listed analyst price target the way there would be for a Nasdaq or NYSE company. Any valuation figures circulating publicly come from private funding rounds or secondary-market share sales, not from equity research coverage.
How Often Should I Check My Space Stock Dashboard?
Daily monitoring covers most retail investing needs, but catalyst-heavy weeks, like ones with a scheduled launch or an earnings call, warrant checking alerts in real time rather than waiting for an end-of-day review. Setting automated alerts for price, news, and contract awards reduces how often you need to actively check the screen.